Often issues can occur that may not cause errors that a user can see. Luckily, Console Logs can provide OnBoard Technical Support or internal IT within your organization with important information that can help to narrow down the cause of an issue. We’ll walk through the steps to view the Console Logs to find errors and save the logs as a file that can be easily sent to Support or your IT.
Important Note: This works best for issues or errors that are repeatable, so you'll want to do this in the same session as you experience an issue if possible.
Chrome
With a Chrome browser window open, hit the F12 button (usually located at the top of the keyboard above the Backspace key). This should open the Developer Tools, and you may need to make the Developer Tools window a bit larger until you can see a “Console” button.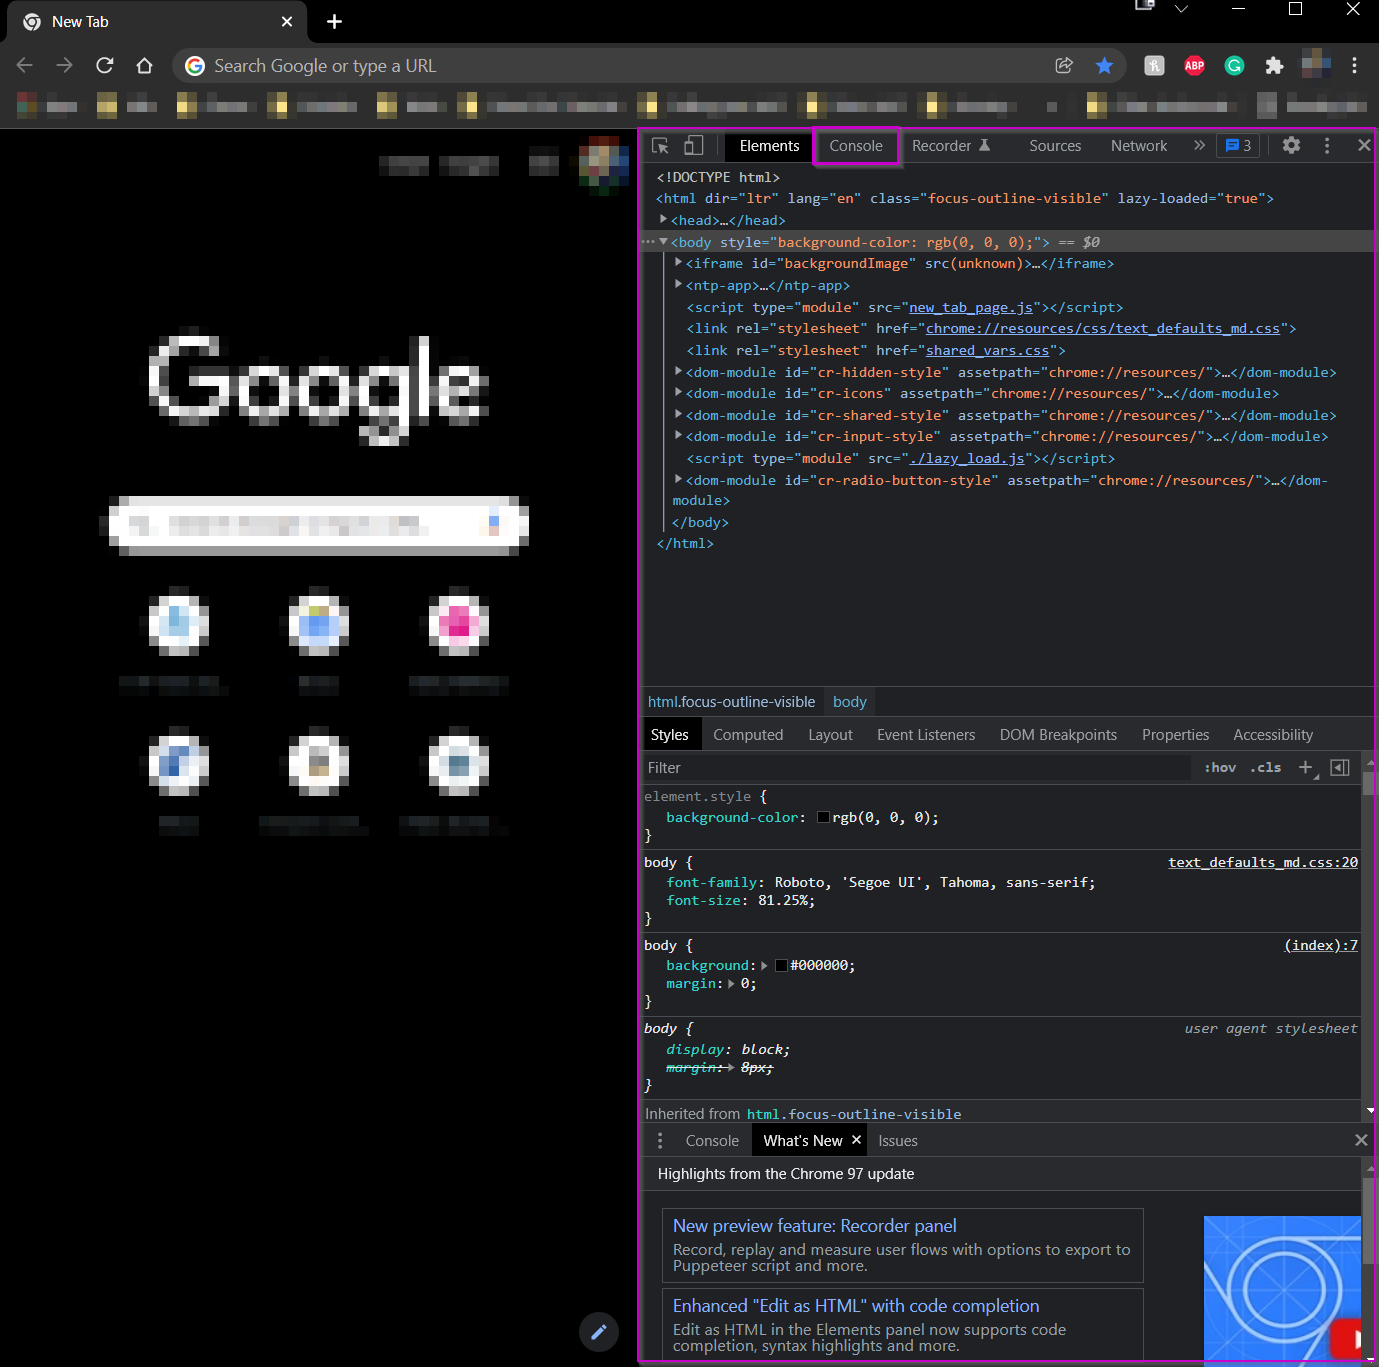
Click on Console.
With the Console selected and open, Refresh your page in OnBoard using the F5 key at the top of your keyboard, or your browser’s Refresh button.
Once the page is refreshed, reproduce the issue in question, which may add entries to the Console Logs.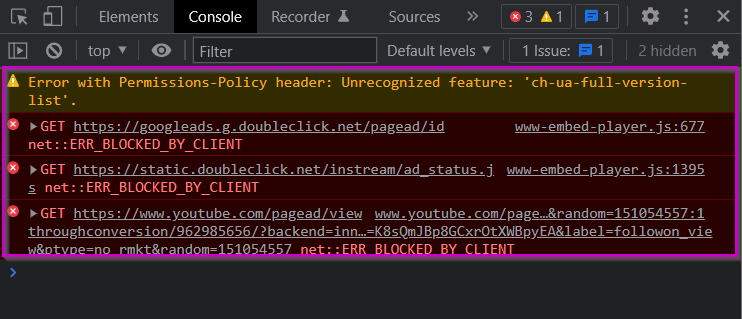
If the Console does now have information listed in it, we'll want to save it for sending.
Right-click in the Console Log area and choose "Save As."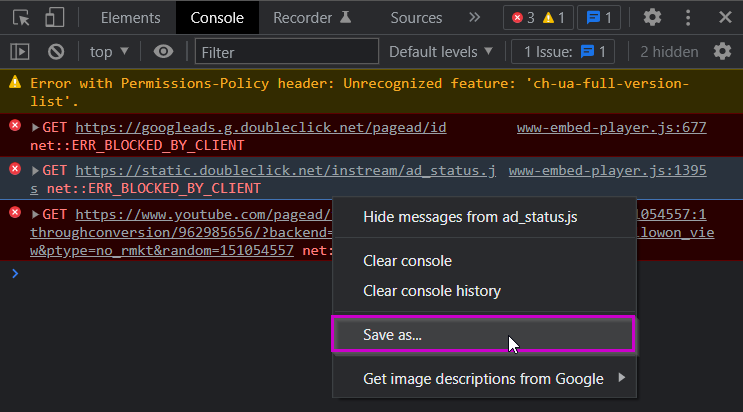
Save the file somewhere that is easy to access, like your Desktop, Downloads, or Documents folder.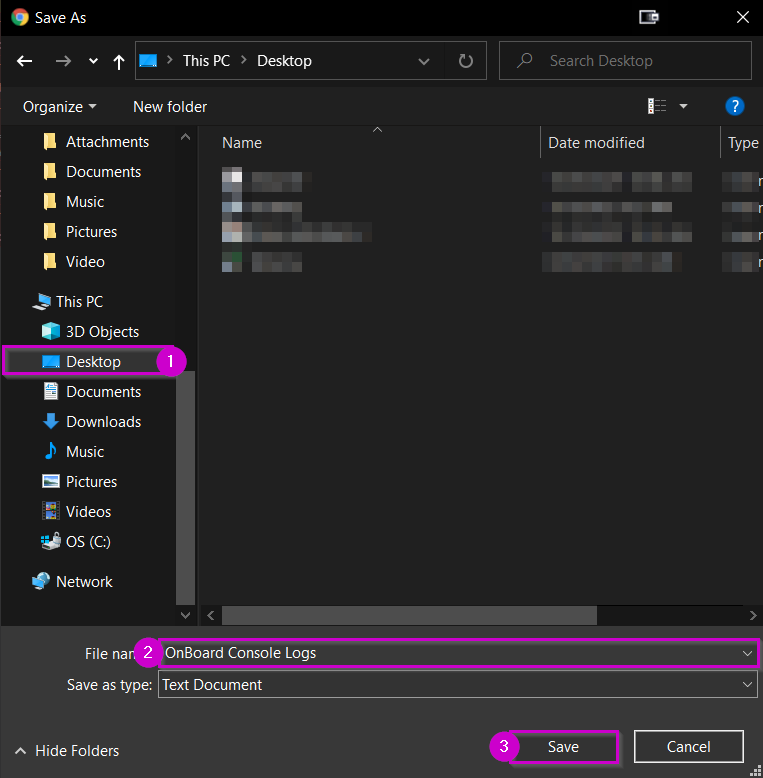
Once the Console Logs are saved, you can find the file in the location it was saved and attach it to a reply to a ticket or email.
Edge
With an Edge browser window open, hit the F12 button (usually located at the top of the keyboard above the Backspace key).
Edge may prompt you to open "DevTools." If you'd like to just open the DevTools automatically instead of receiving this prompt again check "Rember my decision." Click on "Open DevTools."
You may need to make the Dev Tools window a bit larger until you can see a “Console” button. 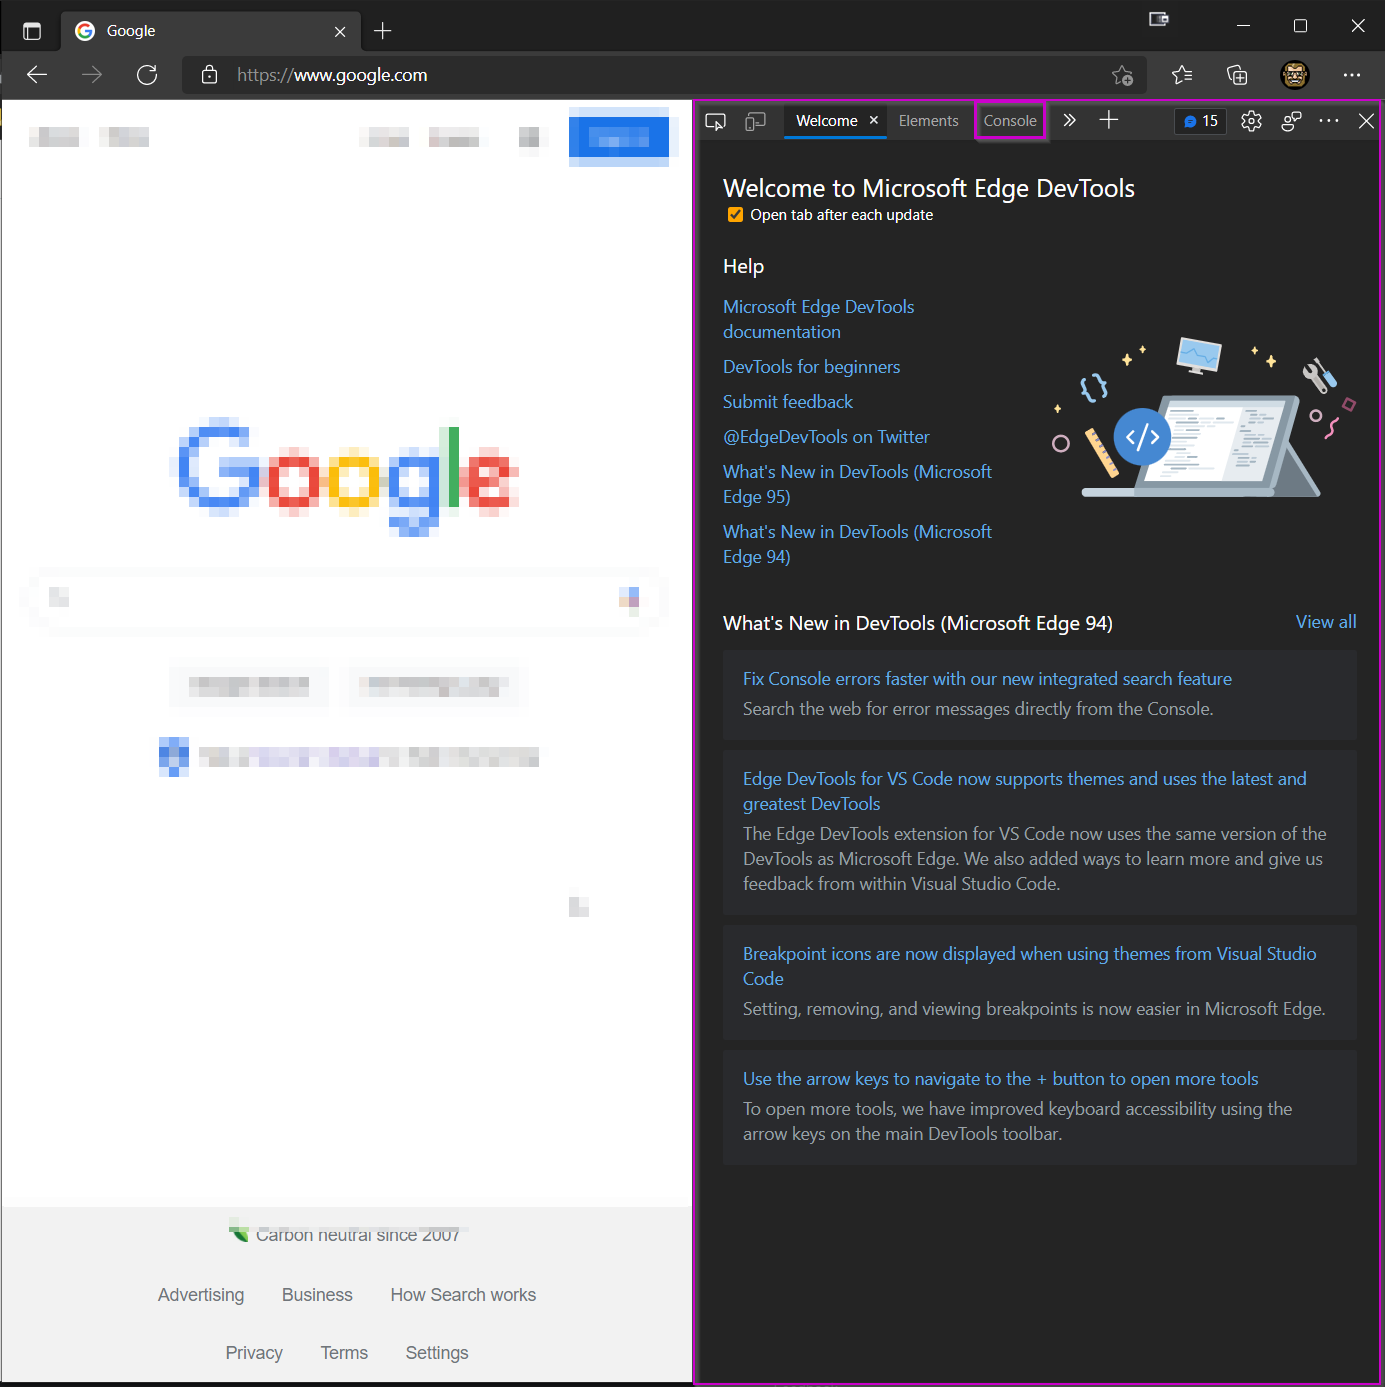
Click on Console.
With the Console selected and open, Refresh your page in OnBoard using the F5 key at the top of your keyboard, or your browser’s Refresh button.
Once the page is refreshed, reproduce the issue in question, which may add entries to the Console Logs.
If the Console does now have information listed in it, we'll want to save it for sending.
Right-click in the Console Log area and choose "Save As."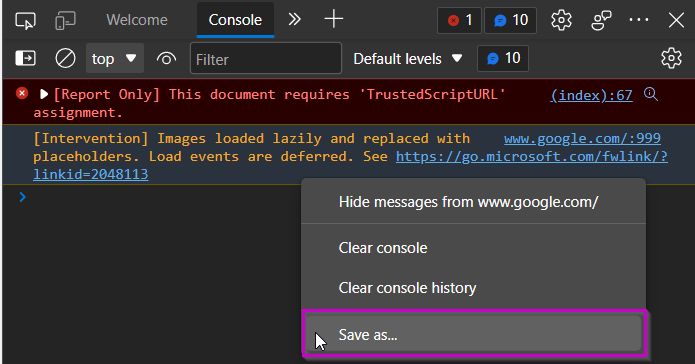
Save the file somewhere that is easy to access, like your Desktop, Downloads, or Documents folder.
Once the Console Logs are saved, find the file in the location and attach it to a reply to a ticket or email.
FireFox
With a FireFox browser window open, hit the F12 button (usually located at the top of the keyboard above the Backspace key).
This should open the Developer Tools. This may open on the bottom or side of your browser depending on your settings.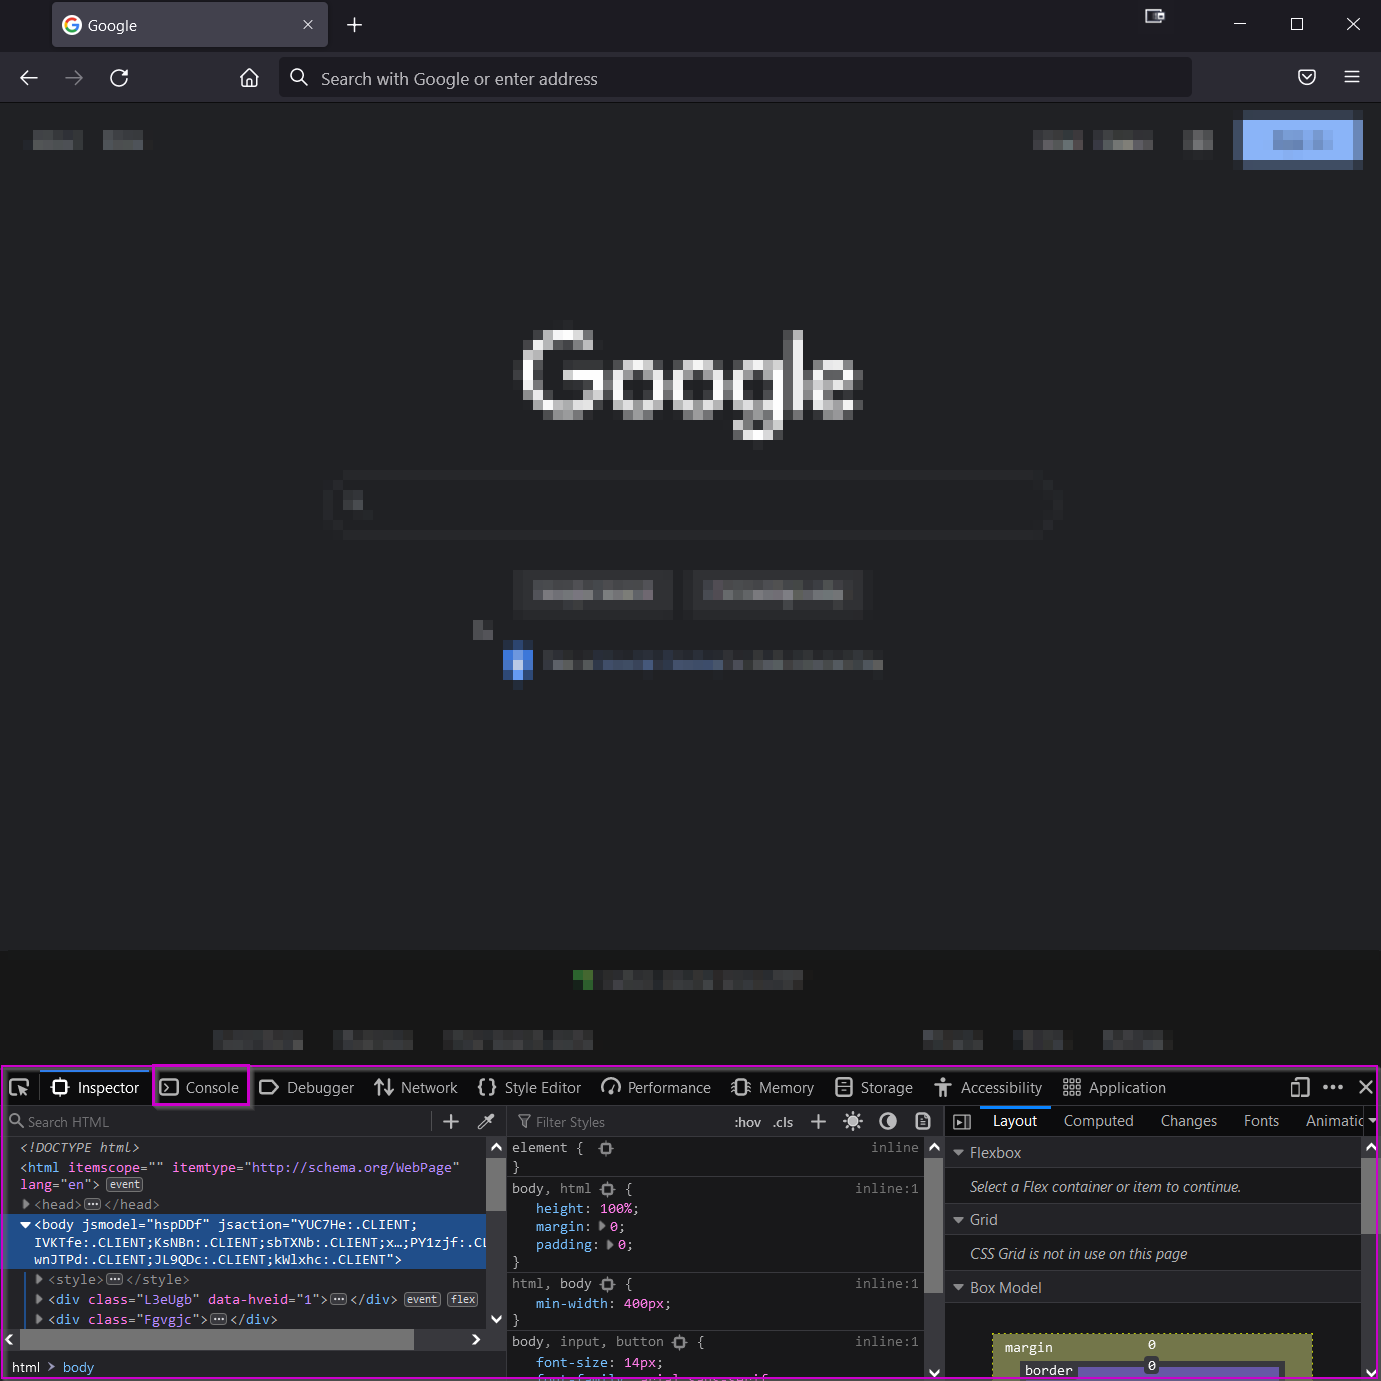
Click on Console.
With the Console selected and open, Refresh your page in OnBoard using the F5 key at the top of your keyboard, or your browser’s Refresh button.
Once the page is refreshed, reproduce the issue in question, which may add entries to the Console Logs.
If the Console does now have information listed in it, we'll want to save it for sending.
Right-click in the Console Log area and choose "Select All" to select the errors.
Right-click again and choose to "Copy Message" to copy the selected log entries.
Open a text editor like Note Pad or Word and paste the logs in.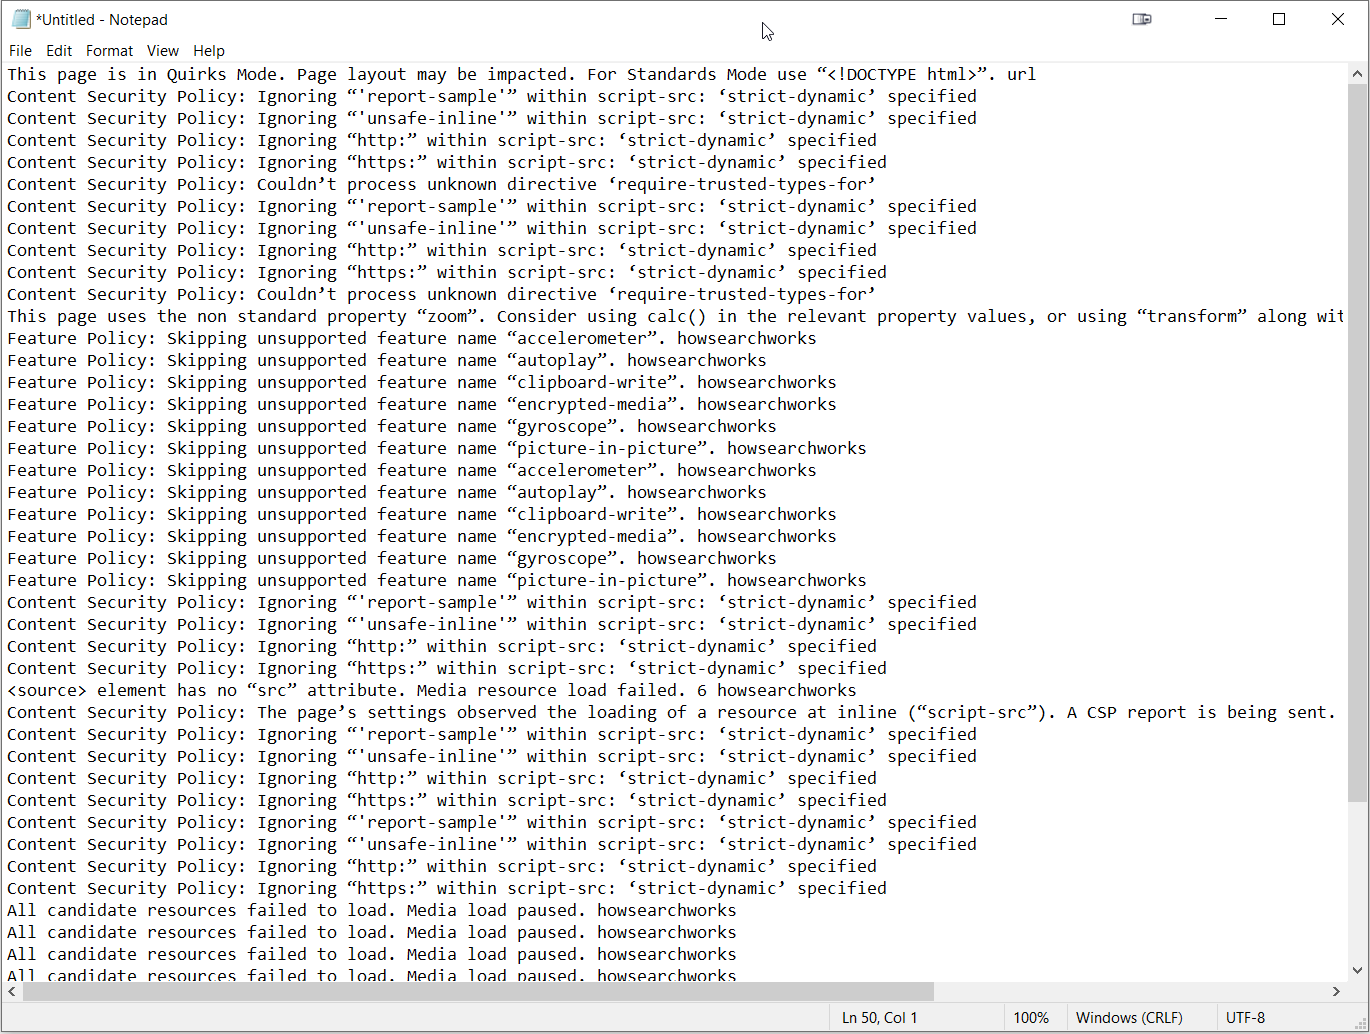
Save the file somewhere that is easy to access, like your Desktop, Downloads, or Documents folder.
Once the Console Logs are saved, find the file and attach it to a reply to a ticket or email.
Safari
With Safari open, click on the Safari menu at the top left and choose "Preferences."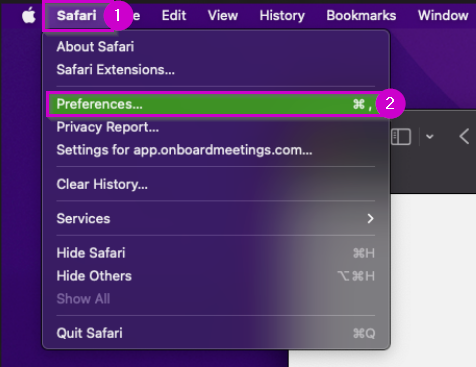
Click on the Advanced Tab, then click to activate the "Show Develop menu in menu bar" option.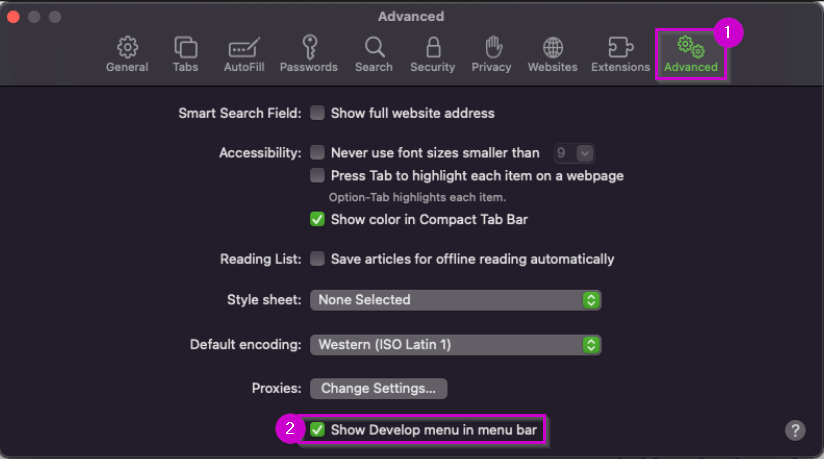
Check that the "Develop" menu option now appears between "Bookmarks" and "Window" menu options.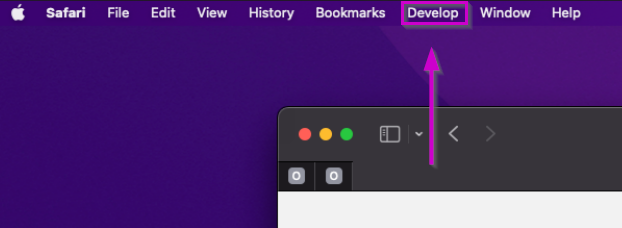
Close the Preferences window.
Click the new Develop menu option and select "Connect Web Inspector". 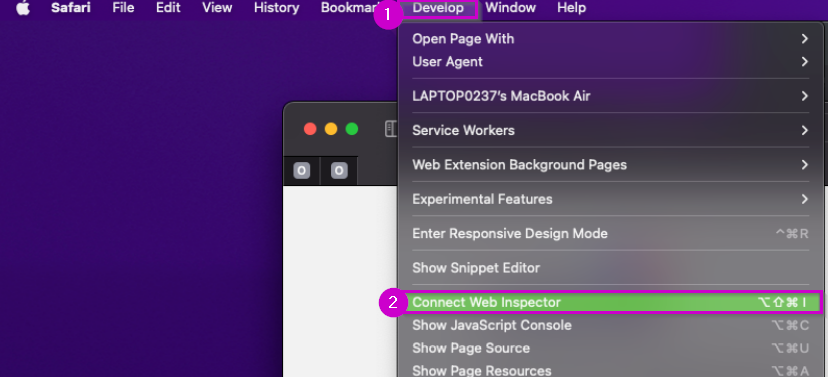
This will open the Developer panel. Click on "Console."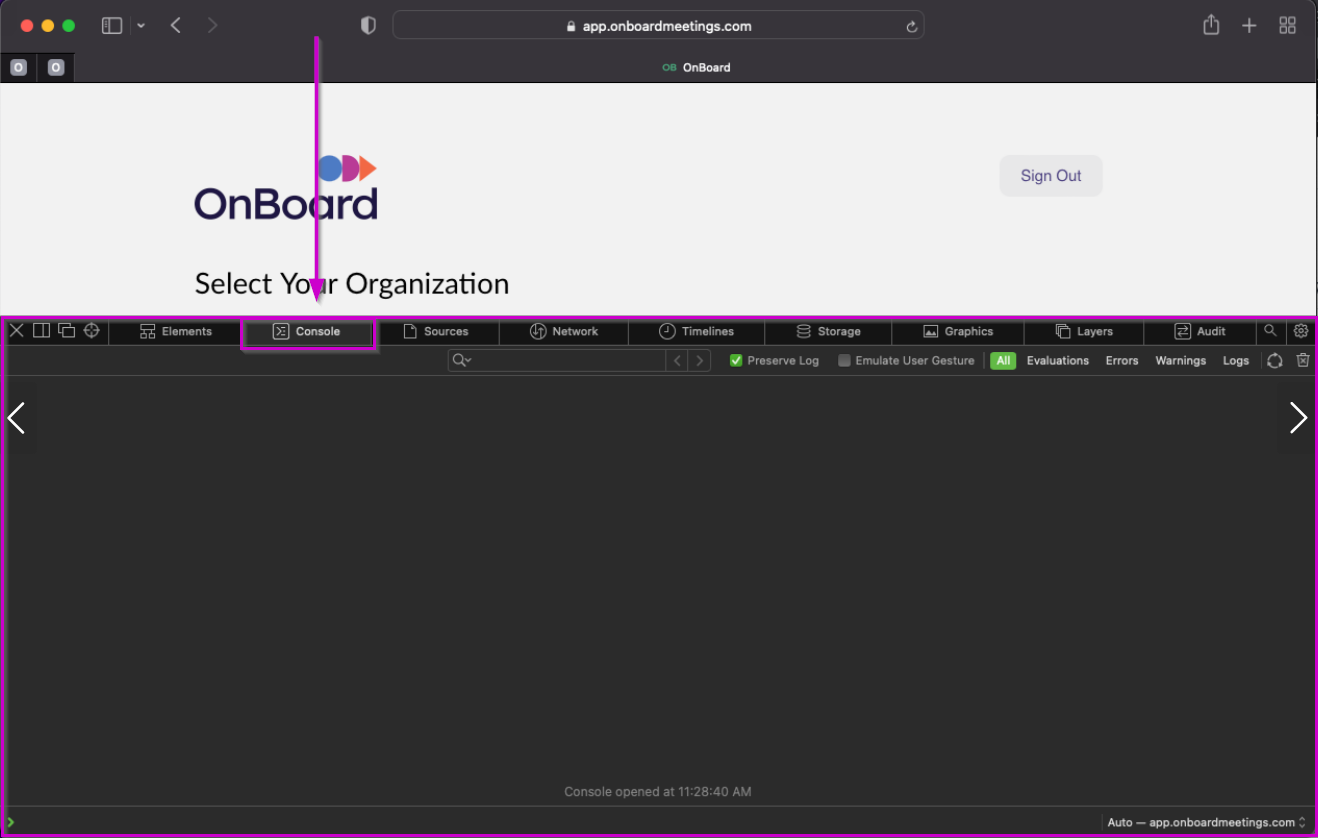
Click to enable the checkbox for the option "Preserve Log."
Refresh your page in OnBoard using the F5 key at the top of your keyboard, or your browser’s Refresh button.
Once the page is refreshed, reproduce the issue in question, which may add entries to the Console Logs.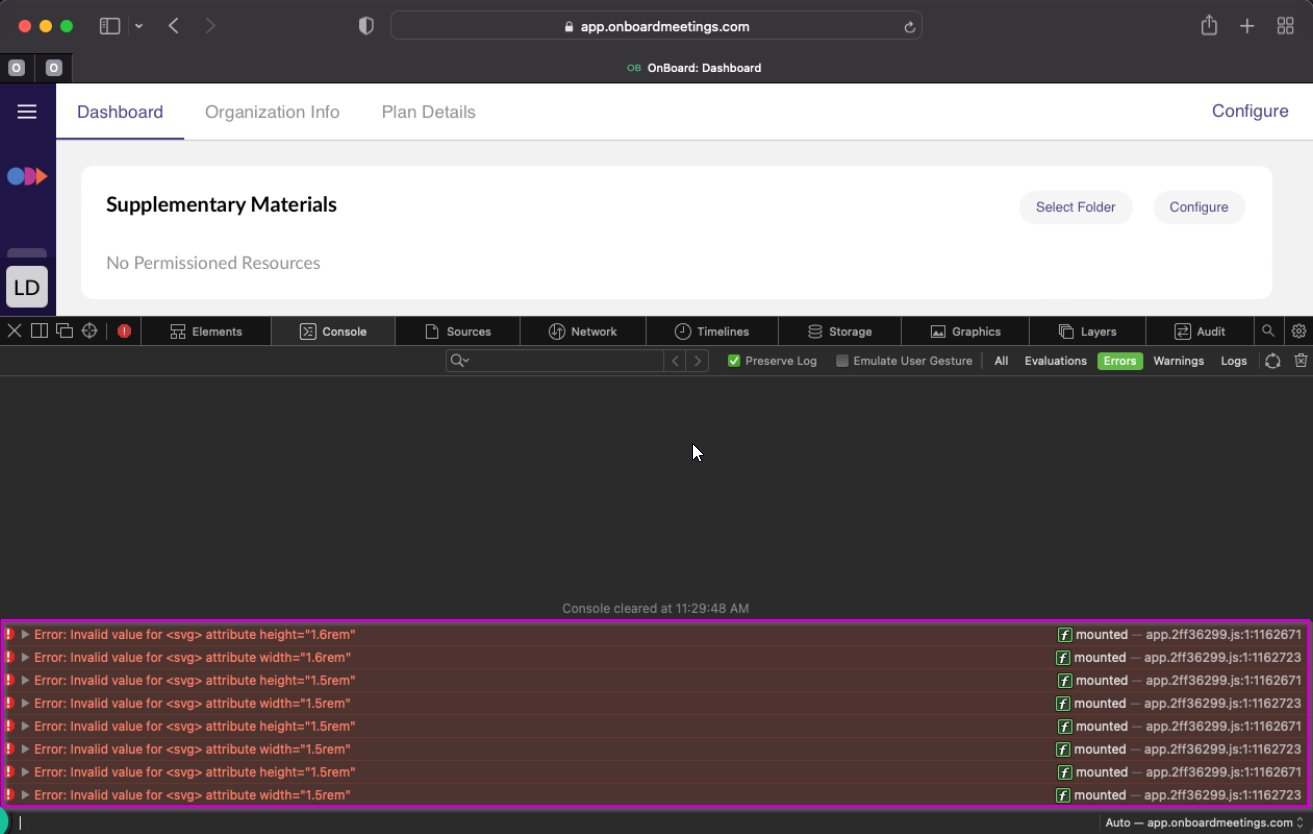
Choose "Select All" to select the errors.
Copy the selected items.
Open TextEdit and paste the Console Logs into the file.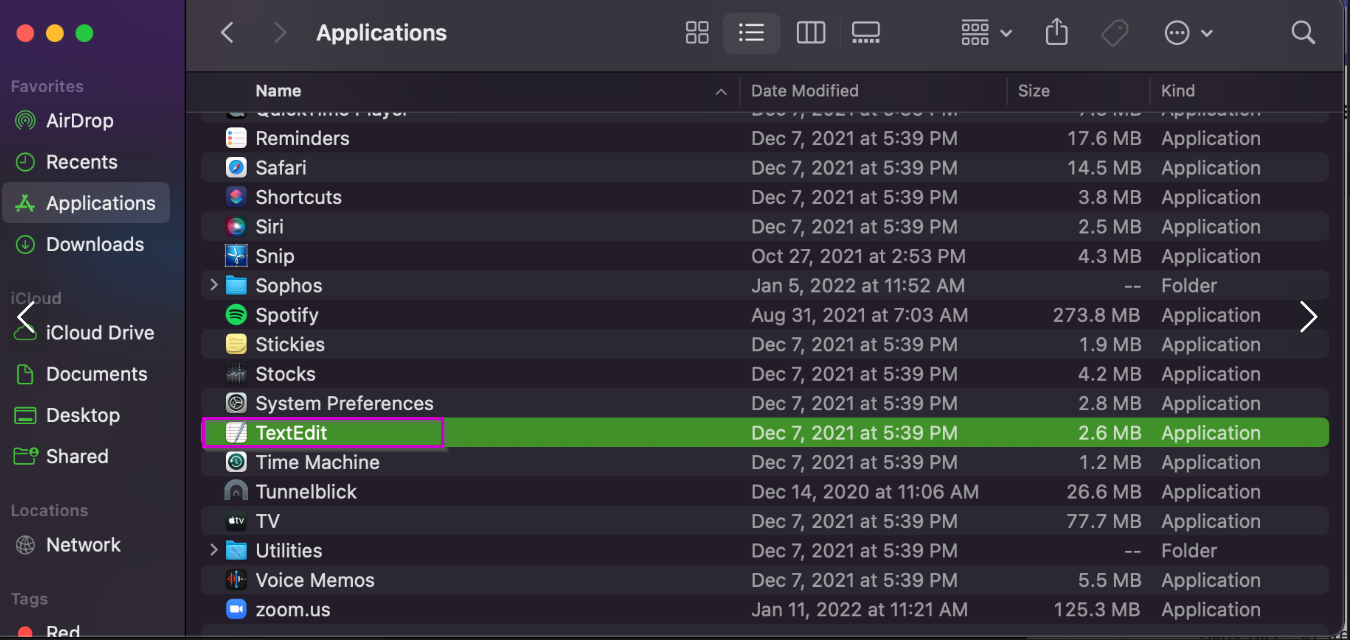
Save the file somewhere that is easy to access, like your Desktop, Downloads, or Documents folder.
Once the Console Logs are saved, find the file and attach it to a reply to a ticket or email.
Comments
0 comments
Article is closed for comments.